
About goJek
GoJek is Southeast Asia’s leading on-demand multi-service platform and digital payment technology group. Spread across 4 countries with over 20+ services, Gojek has become a SuperApp in a very short amount of time. With over 80+ engineers working on Android application catering to the whims and expectations of 50 million+ users, it is imperative to have smooth development workflows with strict checks and balances in place.
At GoJek, the devX team is responsible for ensuring that the code pushed to repository is smooth while adhering to the high engineering standards that are expected of a super app. The team was recently set up and had already started working on streamlining the process and defining ideal practices to be adopted company-wide.
We started collaborating with the devX team at GoJek in the second half of August with the broad goal of
- Improving the developer velocity on Android Platform with faster feedback for their code ● Improving the code quality without hampering the development speed
- Holistic View of the App’s Code Quality and Performance to all stakeholders at all levels
In the last ~3 months, we have already made some improvements to the existing workflow and, more importantly, we have created a stir among developers to emphasize better code quality constructs without impacting their velocity.
Improving Developer Velocity
The very first task ahead of us was to identify the problems in the current development process that can help us improve the developer velocity on Android. We started looking at the low-hanging fruits with huge impact that wouldn’t need a lot of cultural alignment as well. With this in mind, we were able to identify and solve the following problem statements
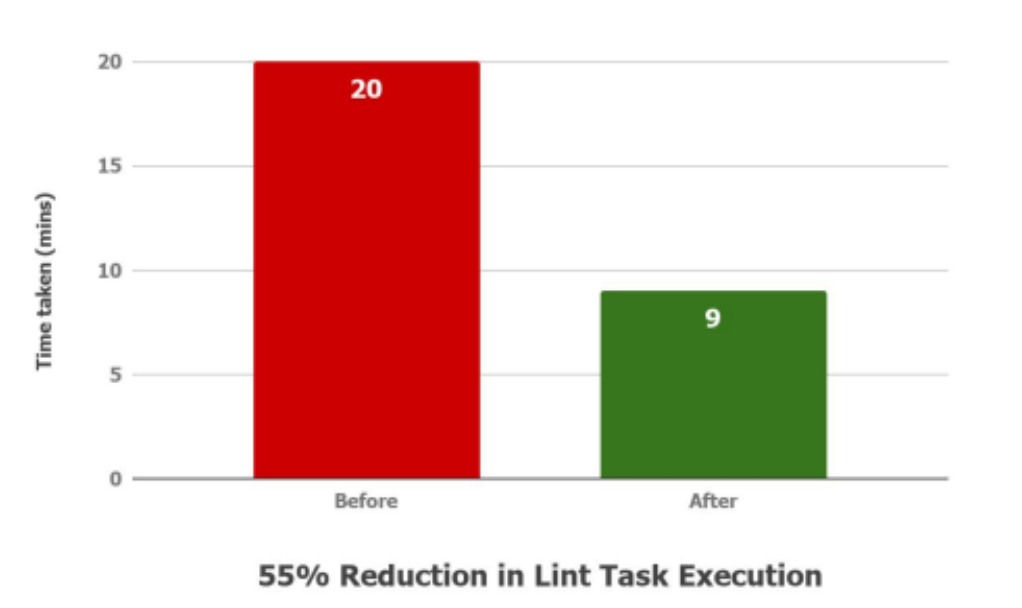
Problem Statement I: Lint Task Execution Time
In the older system, the merge request pipeline had 3 simplistic stages – build, test, and lint. The lint tool checks your Android project source files for potential bugs and optimization improvements for correctness, security, performance, usability, accessibility, and internationalization. The lint task was executed with brute force on the entire project, taking more than 20 minutes on average alone. Additionally, Gradle’s memory consumption for this task would sometimes go haywire due to the vastness of the consumer super-app project.
It was ideal to trigger a lint check of only changed modules and their dependencies in a particular merge request.
Solution approach
Setting up lint to run on only changed files is easier said than done. Getting the module name for changed files was a bit tricky as we could not simply parse the full file path and fetch the folder name from there. Few of the folder names do not correspond to the module name.
Example: The path “project/subproject” has a module name set as “custom-project-name”. Due to this, we wrote a custom gradle task that would fetch the path of the changed file and get the module name in return. This gradle task would have many implementations that go beyond lint execution as we were now able to do things selectively instead of over the entire project.
Outcome
With the help of the above custom gradle task, we were able to bring down the stage execution time from ~20 minutes to ~9 minutes. That is roughly 11 minutes per pipeline. Given, that 60 pipelines are triggered in a day on average for Android, we saved roughly 11 developer hours a day.
Problem Statement II: Readability and Ease of development of yaml files
The order and execution of different stages of a pipeline are defined by a configuration file. For each stage, one can set n number of instructions.
The init and housekeeping/cleanup commands for each stage of the pipeline were written directly in gitlab-ci yml config file. Over time, more stages (or instructions to existing stages) led to the bloating up of this file and decreased readability and in turn, close to impossible debuggability.
Solution approach
We refactored all such commands to apt scripts instead of declaring them sequentially in the yml config file keeping in mind that the config file should only be responsible for setting the configuration of the pipeline stages.
Outcome
The refactoring led to a separation of concern for the respective scripts. We introduced an abstract path for all the shell scripts to be used in the project. This increased code readability and a more structured project.
Problem Statement III: Inefficient use of CI pipeline cluster
The CI pipeline stages run over runner pods which are deployed via Kubernetes over Google Cloud Platform. This is a charged operation and the cost depends upon the configuration (memory, cores, disk space) of the runner pod.
The existing system consisted of all runners with similar configuration – 35 GB of memory with 15000 mCPUs. This was not really suitable as smaller tasks would take up a lot of resources even when not required. We were not cost-optimized or space-optimized at this point. There was a need to have runners with different configs to suit the requirements of different jobs.
Solution approach
To solve this issue, we first overhauled our pipeline structure. From 3 stages, we moved to 5 stages, namely:
- Test
- Build
- Prepare for Code Quality Analysis
- Code quality analysis
- Post-build analysis
With this, it was clear that we needed runners with 3 different configs:
- High config runners – Test, Build, and Lint jobs would run on these. They would be of 35 GB memory and 15000 mCPUs.
- Mid config runners – Pre-code quality analysis, detekt task. They would be 10 GB memory and 8000 mCPUs.
- Low config runners – Post-build analysis, Sonar compliance. They would be of 2 GB memory and 2000 mCPUs.
Outcome
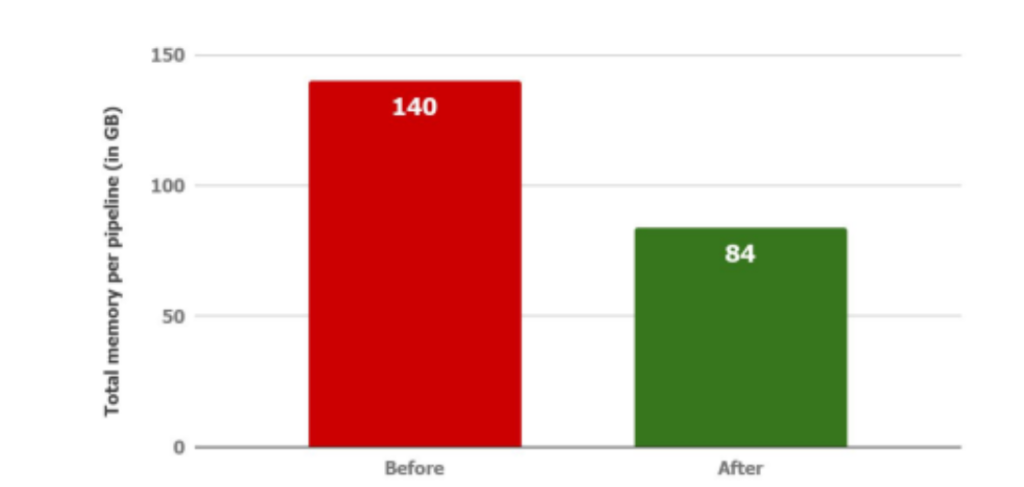
Of the 1.2TB cluster space, previously we used to have 28 fixed same config runners. With the new structure, we were able to deploy 40 separate runners across high, mid, and low configs. This fastened up the pipeline picking time. Previously, each pipeline (with 4 stages) would take up 140GB of memory (4 runners of 35GB each). However, with the new setup, each pipeline would consume 84GB of memory (2 runner of 35 GB, 1 of 10GB, 2 of 2 GB each).
Improving the Code Quality
The outcomes of developer velocity problem statements, gave us enough space and liberty to add more checks and balances in the CI pipeline without further degrading the pipeline execution time. The other target we were consistently obsessed with was maintaining the code quality and not let it degrade.
Problem Statement I: Lack of common coding construct for Android super-app project
When working on an application of GoJek’s super-app scale, it is imperative for engineers to stick to a common coding pattern with static code analysis checks in place. While this was followed by only a handful of teams, there was tremendous scope for building a common coding construct for better code structure, readability, and debuggability.
Solution approach
As part of adopting better code quality practices, we decided to integrate detekt into the super-app project. The problem was 2-folds:
- Implement a centralized detekt config to ensure all modules in the project adhere to the same coding constructs.
- Bring people on board with the idea that a common coding construct was for the betterment of the project.
We first floated the idea in our team OKR discussion. Once it was decided that we would go with a centralized coding construct, we pitched the idea to the larger audience at the weekly Android sync-up discussions.
From there, we started working on integrating detekt with the codebase. We focussed on getting code smells and complexity metrics initially. Since the complexity metrics were not being logged anywhere by detekt tool, we ended up contributing to detekt’s codebase itself.
The next challenge was not to increase the pipeline time that we had worked so hard on reducing. So we introduced the parallelization of jobs. We integrated detekt to run in parallel with lint, thereby saving the ~10-12 minutes which detekt takes to execute. Furthermore, we enabled detekt to run only on changed modules with the task that we had written for lint. This brought down detekt task’s average time to ~3-4 minutes.
Outcome
We integrated more code quality analysis tools and set them to fail a pipeline if the new code doesn’t adhere to the standards decided upon. This would make the code reviewer’s life easier and enable the developer to write better and neater code.
This new introduction was at no extra cost of time as well since it was executed in parallel to the lint task.
Problem Statement II: No checks and balances to ensure code quality [WIP]
We want to ensure that any new code comes in with its corresponding tests so that we are always maintaining/improving the test coverage.
Solution approach
To encourage a more test-driven coding approach, we are currently working on failing a merge request if it reduces the existing code coverage of that specific module. This is a work in progress currently.
Holistic View of the App’s Code Quality and Performance
Problem Statement: No holistic view of the app’s code quality and performance
Due to strict security policies, the existing dashboards were hosted on Grafana which was deployed on a private network. This gap prevented people from viewing the dashboards outside the VPN network. The lack of visibility prevents key stakeholders from monitoring the different metrics.
Solution approach
To address this, the kernel team built an in-house tool on top of Prometheus and called it Lens. The plan was to move all our dashboards from Grafana to Lens.
Moreover, there was no alerting mechanism to inform the team of crucial issues like failing pipelines, APK size increase, pipeline time increase, and such.
Lens dashboards are supposed to be written in Jsonnet language and deployed to a separate project. We migrated all our dashboards into a Jsonnet format scripts and pushed them into a separate project. Few graphical solutions were tricky as the lens tool is itself in a nascent stage. Post that, we added a basic alerting mechanism for failing pipelines, build times more than threshold values, and apk size more than the allowed threshold. Along with that, we added new dashboards to view the code coverage of each module in the Android consumer super-app.
Outcome
The new dashboards were public to all (offices in Gurgaon as well as Jakarta) and hence it brought a wide audience visibility. Within a few days of bringing the dashboard live, we had a few interesting findings that are listed below:
- As the code coverage numbers became more visible, we realized that we had unit tests for only 57 modules (as compared to a total of 140+ modules)
- APK size had grown by 7 mb in last 3 months
- Test pipeline times were increasing with the addition of more tests.
However, over time, we have realized that Lens is not really ideal for our problem statement. We are planning to shift to a counter-based alerting and dashboarding system. This is a WIP.
Trust and Worth
Our Clients